19 Nov 5 Must-Have Metrics on Your Social Media Scorecard for 2019
Posted at 12:06h
in Social Media Measurement

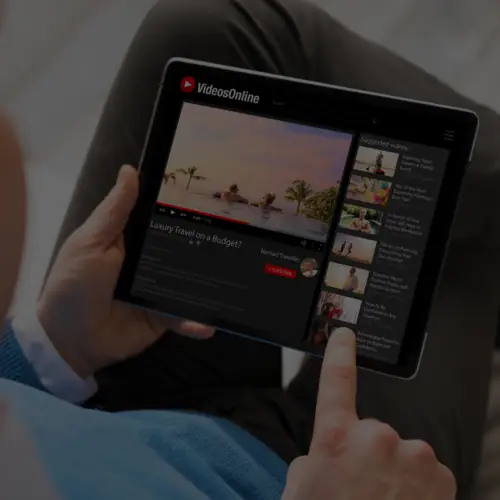
2019 Social Media Metrics
Time flies and, believe it or not, it’s already time to start thinking about planning for next year. Every good strategy requires a good measurement plan. To help you start thinking about 2019 social media metrics, we put together a list of widely used social media objectives and the 5-must-have metrics for each one. Mixing and matching is highly encouraged depending on your business’s individual needs.
Metrics for Measuring a Social Media Marketing Strategy Designed to Drive Awareness:
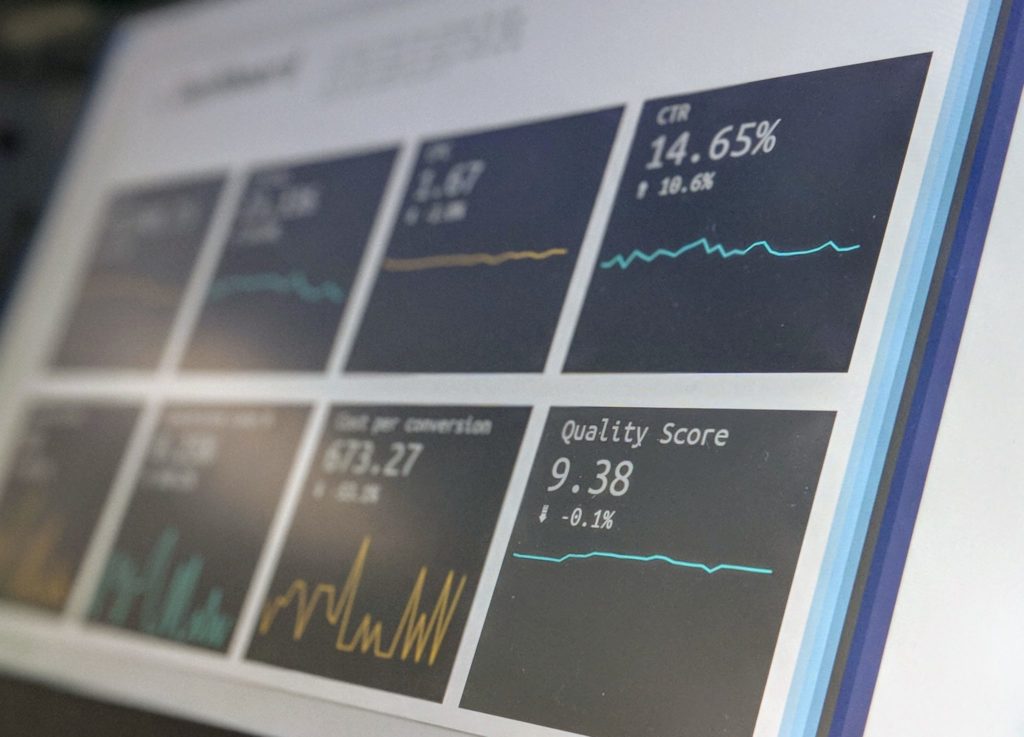 Total Impressions – The basic default. Measure how many times your message is being served. Though not the most insightful of metrics, it’s a good metric for comparing
- Reach – Measure how many unique people your message is reaching. To take it a step further, if possible, measure your reach %.
- Frequency – How often you reaching the same people with your messaging. How many times do you need to deliver the message to see a behavior change?
- Number of Shares and Mentions – Is your content resonating with your audience to the point that they share it with their social circles? Is your brand or product seeing an increase in mentions on social platforms to indicate an increase in awareness?
- Ad Recall Rate – The above metrics are great, but how do you know that your message is being retained? Facebook offers an estimated ad recall rate on ads that help indicate whether if your ads are raising a lasting awareness. You could also run a brand lift study through the Facebook platform.
Metrics for Measuring a Social Media Marketing Strategy Designed to Drive Leads:
- Number of Leads – This goes without saying right? But what about surrounding metrics that build to that ultimate conversion. That’s what the remaining four metrics are there to help with!
- Click-Through Rate – Best used to judge how effective your content is at capturing audience interest and delivering them to the content that they are, hopefully, expecting and interested in.
- Referred traffic/Landing page Views – Click-through rate is a good way to initially judge content’s ability to drive clicks, but often the number of clicks is lower than the number of traffic driven by your social content. People might bounce before your tracking loads or might have clicked accidentally. Confirm the traffic you sent by looking at those your website analytics platform tracked.
- % of New Visits – If you’re trying to develop new leads, one way to make sure you are attracting new people to your site is measuring the percent of new visits. Is your content referring the same people with each campaign? Or is your marketing net capturing new fish for your funnel?
- Micro-conversions – You might get some direct content-to-lead conversions, but part of a marketing strategy involves moving people through the funnel from awareness to consideration to conversion. Don’t forget about the consideration phase, feed your audience with information to help their decision to convert. Micro-conversions might include visiting a specific page, downloading a whitepaper, or signing up for a newsletter.
Metrics for Measuring a Social Media Marketing Strategy Designed to Drive Sales:
- Engagement Rate – If you frequently feature your products in social content, keep a high-level pulse on engagement rate. Seeing what products are resonating well with your audience can help inform your content strategy as well as your product development team.
- Click-through rate – another high-level indicator to help assess whether or not your content is “thumb-stopping”.
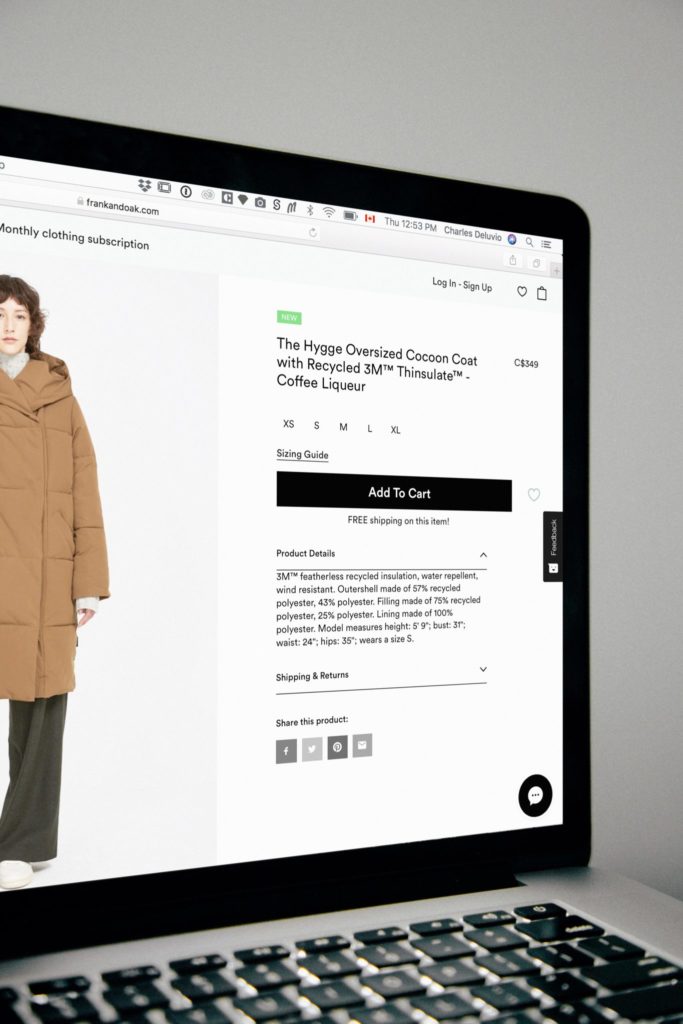
- Online Purchases – Measure how many purchases on your e-commerce platform are a result of your social strategy.
- Offline Purchases – For brands with physical stores, Facebook has an offering that allows you to attribute your social media marketing efforts to purchases made offline.
- Micro-conversions – Measure key actions on your site that help a potential customer take that leap and make a purchase, then retarget to encourage them further down the funnel. Examples here might include viewing a lookbook, specific searches, or adds to cart.
Metrics for a Social Media Marketing Strategy Designed to Increase Customer Satisfaction and Loyalty:
- Inbound message volume – Assess the volume of customer praise, questions, and complaints. Consider segmenting messages into topics to help identify common issues or questions.
- Response Rate – Measure the percentage of inbound messages you are responding to.
- Average Response Time – Measure how quickly you are responding to your customers.
- Resolution Rate – Out of inbound messages that require action or answer from the brand, how many have been solved and how many issues are outstanding?
- Sentiment – Is your social audience praising your brand or complaining
There are many ways to build out your scorecard depending on your industry and your objectives. We would be happy to help you define your 2019 social media metrics that align to your overall strategy.