09 Feb The Latest Facebook Performance Metrics; How Does Your Brand Compare?
More often than not Facebook plays a significant role in a brand’s social strategy. As such, brands rely on the community built around their pages. Back in 2014, everyone from brand marketers to local musicians started freaking out about the decreasing reach posts received following drastic changes to the News Feed algorithm. Facebook made adjustments in an effort to curb the volume of content that members could see and focus on engaging content. We did an initial analysis of the decreasing fan reach trend several years ago and thought it was worth revisiting. The post below includes an updated look at reach in addition to several other interesting findings compiled by the entire Ignite Social Media analytics team! These numbers can be used as a guide to see how your brand’s Facebook performance compares to industry.
Methodology
We took a sample of 18,538 posts, across 30 brand pages in multiple industries from January 1st, 2015 to December 31st, 2016. From our initial data download, we removed cover photo updates as they are atypical posts and frequent outliers. Additionally, we removed posts that had engagement rates over 100% because that is literally impossible and an error in Facebook’s reporting. Engagement rate is defined as Engaged Users (the number of UNIQUE people who engaged with your content) divided by Reach (the number of UNIQUE users that see your content); hence impossible.
Organic Reach Shows Signs of Improvement
Just over three years ago, December 2013, we reported that Facebook brand pages were experiencing a significant decrease in reach. Our analysis concluded that organic reach decreased by an average of 44% since the beginning of December 2013. We revisited the analysis nearly a year ago to find that, on average, brand content was reaching 1% of page fans. In case you missed it, the blog post went something like this:
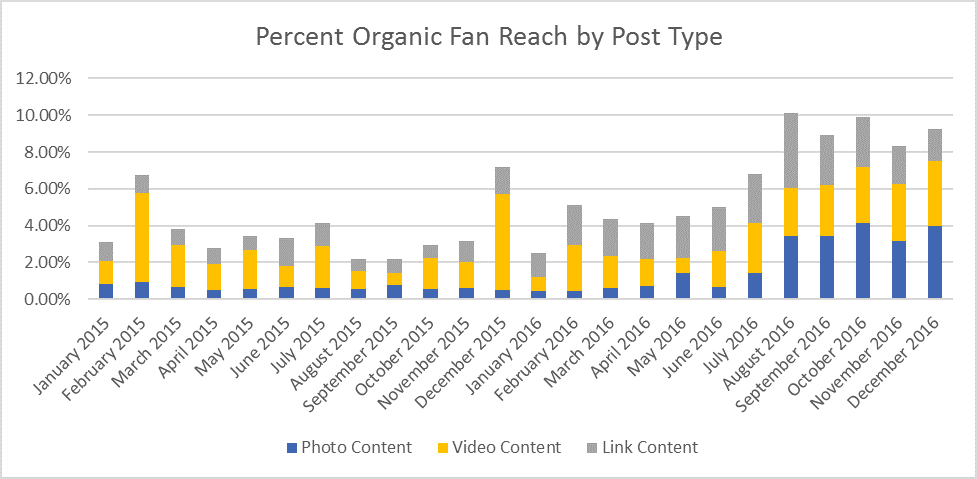
A few months ago, we noticed organic reach really starting to pick up across brand pages. We took a look at the median fan reach percent for organic posts in our sample and found a definitive increase above 1% starting in the spring of 2016 and peaking in late summer/fall. Rates since decreased since the 3.5% peak in August, but they have remained steadily around 2.5% in November and December.
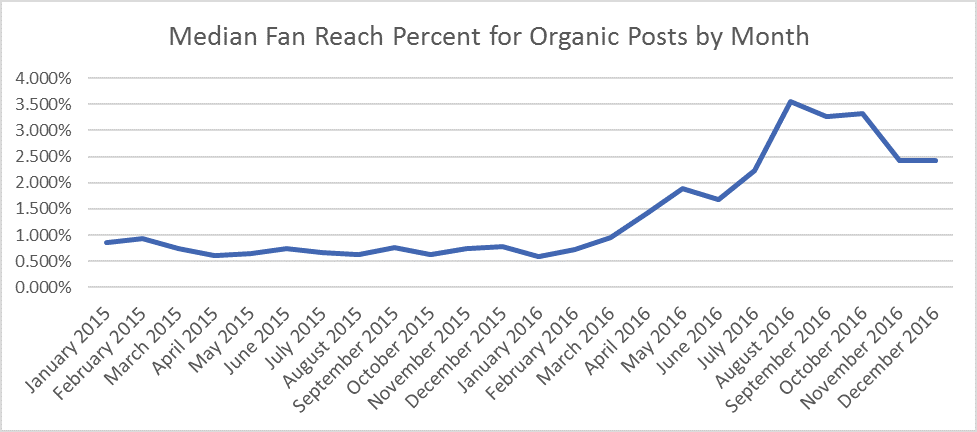
Worth noting, Facebook announced in November it was “overcounting how many people were exposed to marketers’ organic posts,” which could potentially explain the slight drop towards the end of the year. Even with the decrease, the percentage of fans reached by organic content more than doubled in 2016. With that, it seems that Facebook organic reach is no longer dead, but is showing some signs of life. Does that qualify as undead? “In 2017, Facebook introduces new metric: Zombie Reach”
Video Content Reigns With Reach
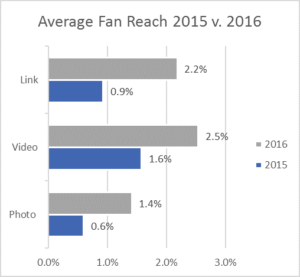
Those familiar with social media analytics are often familiar with the patterns associated with post type and performance. Using organic fan reach percent as a measure of how much of the audience saw the post, we determined what type of posts is most likely to be served in the newsfeed. From the analysis of two years of Facebook video, photo, and link post data (status posts were removed from this analysis due to a small sample size.), video posts emerged as the most-weighted post type. This is not surprising considering Facebook’s heavy focus on video over the past few years. On average, organic fan reach for video content performed at 2.18% per month but experienced a lift above 3% in November and October. Photo content averaged a monthly reach percent of 1.32%, though slightly outperformed video content in December at nearly 4%. Link posts, though still performing below photo and video posts, have experienced a significant increase, performing closer to 2% versus 2015 performing at an average of 1% each month.
User Engagement Stays Steady
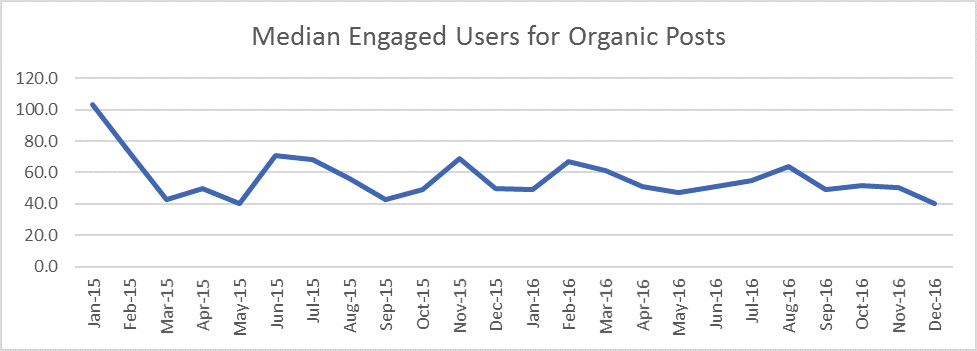
Median engaged users per page have remained relatively consistent from September 2015 through December 2016, seeing minor peaks and valleys, but keeping on a steady trend month-to-month.
However, looking at engaged users by post type tells a decidedly different story.
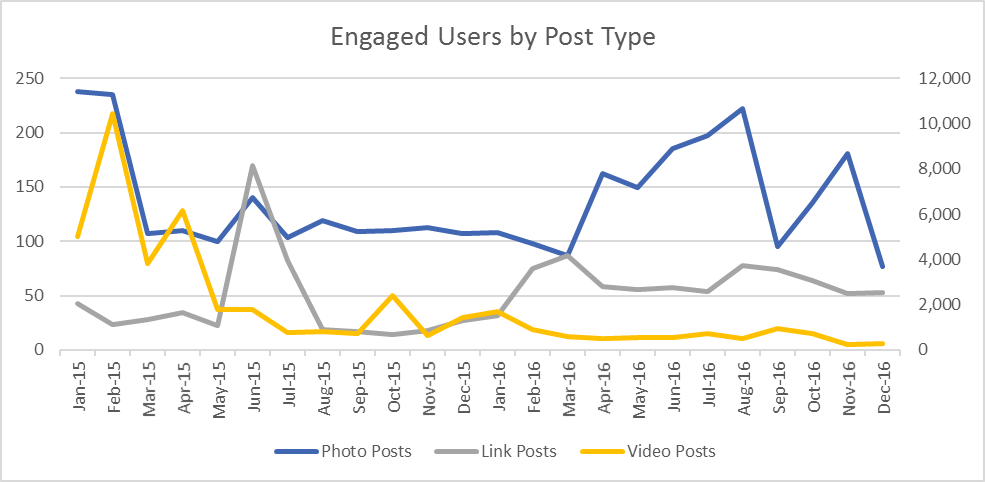
Video content (seen on the secondary axis) has seen a steady decrease in engaged users since May 2015, likely due to the way Facebook calculates an engaged user on a video post. Conversely, link content saw an uptick in engaged users early in 2016, which remained relatively consistent throughout the year. Photo content varies much more, with more regular peaks and valleys within the data throughout 2016.
Comparing this to changes in reach per post type in recent months allows us to understand changes in engagement rate across photo, video, and link posts in the second half of 2016. With reach of photo and link posts increasing, but engaged users remaining relatively consistent, engagement rates across post types have decreased since July 2016, most notably in regards to photo content. Where photo content once received average engagement rates between 5-6%, the past six months has resulted in photos receiving rates between 2-3%.
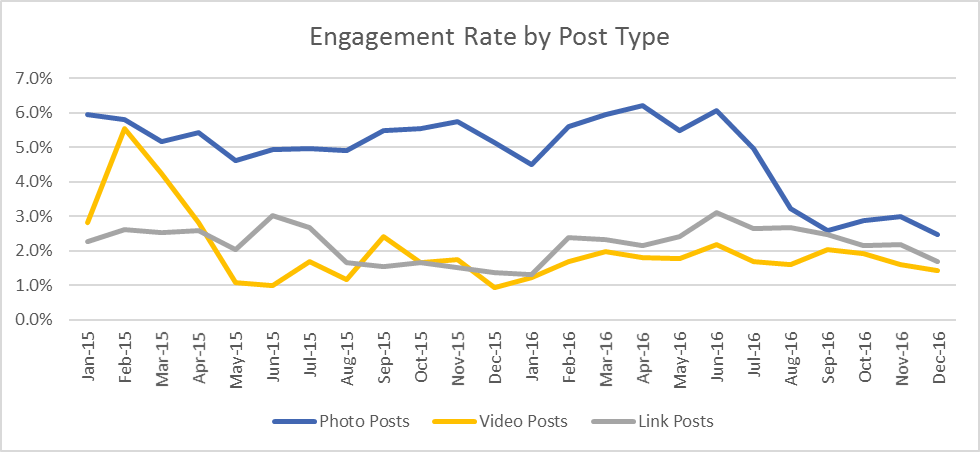
In addition, link and video content has also seen engagement rate on a slight decline since July 2016, suggesting that increases in reach are doing little to bolster engagement overall.
Sharing Drops Over Time
According to the vast Facebook data collected, both organic and paid share rate appear to be decreasing. As shown in the graph below, share rates began to consistently decrease around June 2016 and continue to lessen through the end of the year. From June to December, there was a 33% decrease in Paid Share Rate and a 62% decrease in Organic Share Rate. In December and October, Total Share Rate had the lowest rates for the past two years. December was 48% below the median Total Share rate of 0.143%, while October was 60% lower.
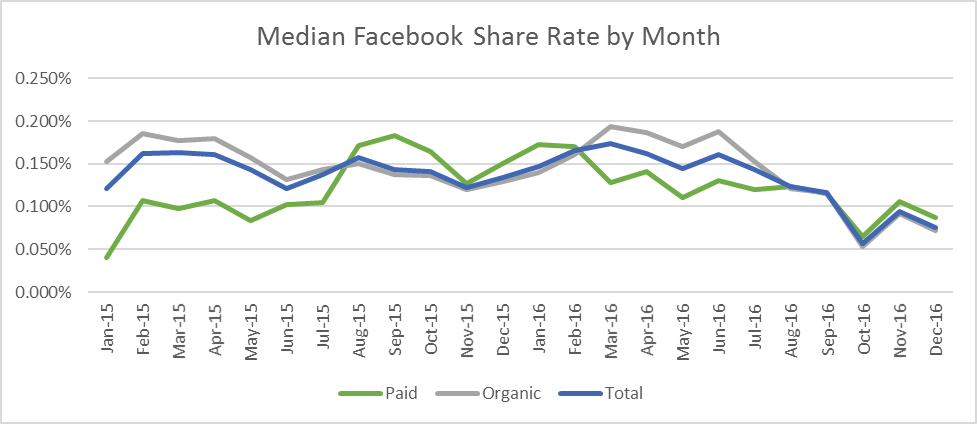
An exact cause of this decrease is difficult to state. Earlier in 2016, there were reports users are sharing less personal content on the platform, though still generally sharing content at a high volume.
Has Facebook Fan Page Growth Plateaued?
Fan acquisition was a leading KPI up through 2014; however, as Facebook drastically cut organic reach and shifted focus on quality content and engagements it became a less important metric. With the algorithm change, we wanted to take a look at how quickly pages are growing, and losing, fans.
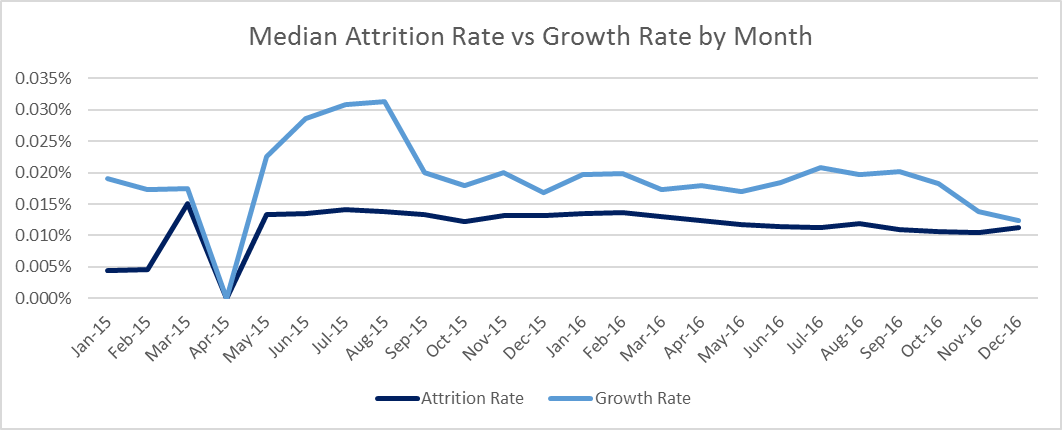
Following a purge of fake and inactive accounts in March 2015, growth rate spiked, but quickly returned to a pre-purge average following August 2015. Since July 2016, Facebook fan growth rate has been steadily declining, most significantly in the last two months. With attrition rate remaining relatively consistent since May 2015, this indicates that brands have likely hit a plateau in regards to growth, and are organically experiencing less acquisition from content alone in recent months. However, increases in organic reach year-over-year indicate that slowed growth has led to a higher increase of fans organically seeing brand content.
Food For Thought
In a surprising turn of events, Facebook reach is not dead contrary to previous reports; however, both share and engagement rates are on downward trends. Is Facebook adjusting the algorithm to favor eyeballs over actions or is there a general shift of user behavior? We will continue to monitor these trends for our clients in order to find out! If you’re interested in how your brand is performing, we’re happy to take a look at your numbers.


